Unit 1
Introduction to Cgma
Computer Graphic
Computer graphics is an art of drawing pictures, lines, charts, etc using computers with the help of programming
Interactive and Passive Graphics
(a) Non-Interactive or Passive Computer Graphics:
In non-interactive computer graphics, the picture is produced on the monitor, and the user does not have any controlled over the image, i.e., the user cannot make any change in the rendered image. One example of its Titles shown on T.V.
Non-interactive Graphics involves only one-way communication between the computer and the user, User can see the produced image, and he cannot make any change in the image.
(b) Interactive Computer Graphics:
In interactive Computer Graphics user have some controls over the picture, i.e., the user can make any change in the produced image. One example of it is the ping-pong game.
Interactive Computer Graphics require two-way communication between the computer and the user. A User can see the image and make any change by sending his command with an input device.
Advantages:
- Higher Quality
- More precise results or products
- Greater Productivity
- Lower analysis and design cost
- Significantly enhances our ability to understand data and to perceive trends.
Representative use of computer graphics
- User interfaces : GUI, etc.
- Business, science and technology: histograms, bar and pie charts, etc.Office automation and electronic publishing : text , tables, graphs, hypermedia systems, etc.
- Computer-aided design (CAD): structures of building, automobile bodies, etc.
- Simulation and animation for scientific visualization and entertainment: flight simulation, games, movies, virtual reality, etc.
- Art and commerce : terminals in public places such as museums, etc.
- Cartography : map making
Conceptual Framework for Interactive Graphics
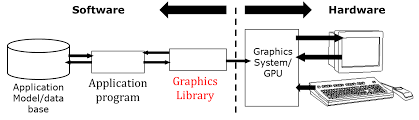
Conceptual Framework has the following elements:
Graphics Library – Between application and display hardware there is graphics library / API.
Application Program – An application program maps all application objects to images by invoking graphics.
Graphics System – An interface that interacts between Graphics library and Hardware.
Modifications to images are the result of user interaction.
Scan Converting a Straight Line
A straight line may be defined by two endpoints & an equation. In fig the two endpoints are described by (x1,y1) and (x2,y2).
The equation of the line is used to determine the x, y coordinates of all the points that lie between these two endpoints.
we represent the line as a sequence of pixels.
Algorithm for line Drawing:
- Direct use of line equation
- DDA (Digital Differential Analyzer)
- Bresenham's Algorithm
standard line equation: y = mx + c.
The slope of a line
The slope of a line defines the direction of a line.
Assume that the two points are X( x1,y1 ) and Y( x2,y2 ).
Its slope, 'm' will be: m = (y2 - y1) / (x2 - x1).
Example:
We have given two points X and Y. The coordinates of X are (0, 0) and the coordinates of Y are (5, 15). The slope of the line will be,
m = (15 - 0) / (5-0) m = 3
We have the slope of the line. Now let us put the slope in the line equation.
y = 3x + c
Origin point is (0,0). So,
c = 0
Putting c=0 in the above equation.
y = 3x
Now we will calculate the intermediate points.
Let x = 1 ⟹ y = 3 x 1 ⟹ y = 3 Let x = 2 ⟹ y = 3 x 2 ⟹ y = 6 Let x = 3 ⟹ y = 3 x 3 ⟹ y = 9 Let x = 4 ⟹ y = 3 x 4 ⟹ y = 12 Let x = 5 ⟹ y = 3 x 5 ⟹ y = 15
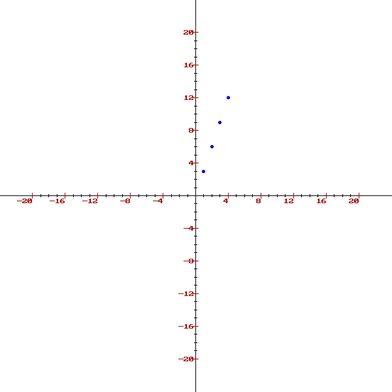
We got the intermediate points which are, (1, 3), (2, 6), (3, 9), (4, 12) and finally (5, 15)
Now we'll plot these points on the graph.
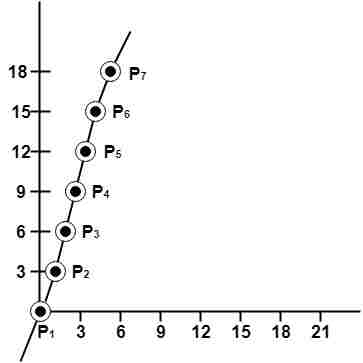
Example 2 : A line with starting point as (0, 0) and ending point (6, 18) is given. Calculate value of intermediate points and slope of line.
Solution: P1 (0,0) P7 (6,18)
x1=0
y1=0
x2=6
y2=18
We know equation of line is
y =m x + b
y = 3x + b..............equation (1)
put value of x from initial point in equation (1), i.e., (0, 0) x =0, y=0
0 = 3 x 0 + b
0 = b ⟹ b=0
put b = 0 in equation (1)
y = 3x + 0
y = 3x
Now calculate intermediate points
Let x = 1 ⟹ y = 3 x 1 ⟹ y = 3
Let x = 2 ⟹ y = 3 x 2 ⟹ y = 6
Let x = 3 ⟹ y = 3 x 3 ⟹ y = 9
Let x = 4 ⟹ y = 3 x 4 ⟹ y = 12
Let x = 5 ⟹ y = 3 x 5 ⟹ y = 15
Let x = 6 ⟹ y = 3 x 6 ⟹ y = 18
So points are P1 (0,0)
P2 (1,3)
P3 (2,6)
P4 (3,9)
P5 (4,12)
P6 (5,15)
P7 (6,18)
DDA Algorithm
DDA stands for Digital Differential Analyzer. It is an incremental method of scan conversion of line. In this method calculation is performed at each step but by using results of previous steps.
Advantage:
- It is a faster method than method of using direct use of line equation.
- This method does not use multiplication theorem.
- It allows us to detect the change in the value of x and y ,so plotting of same point twice is not possible.
- This method gives overflow indication when a point is repositioned.
- It is an easy method because each step involves just two additions.
Disadvantage:
- It involves floating point additions rounding off is done. Accumulations of round off error cause accumulation of error.
- Rounding off operations and floating point operations consumes a lot of time.
- It is more suitable for generating line using the software. But it is less suited for hardware implementation.
Bresenham's Line Algorithm
This algorithm is used for scan converting a line. It was developed by Bresenham.
It is an efficient method because it involves only integer addition, subtractions, and multiplication operations.
These operations can be performed very rapidly so lines can be generated quickly.
Step1: Start Algorithm
Step2: Declare variable x1,x2,y1,y2,d,i1,i2,dx,dy
Step3: Enter value of x1,y1,x2,y2
Where x1,y1are coordinates of starting point
And x2,y2 are coordinates of Ending point
Step4: Calculate dx = x2-x1
Calculate dy = y2-y1
Calculate i1=2*dy
Calculate i2=2*(dy-dx)
Calculate d=i1-dx
Step5: Consider (x, y) as starting point and xendas maximum possible value of x.
If dx < 0
Then x = x2
y = y2
xend=x1
If dx > 0
Then x = x1
y = y1
xend=x2
Step6: Generate point at (x,y)coordinates.
Step7: Check if whole line is generated.
If x > = xend
Stop.
Step8: Calculate co-ordinates of the next pixel
If d < 0
Then d = d + i1
If d ≥ 0
Then d = d + i2
Increment y = y + 1
Step9: Increment x = x + 1
Step10: Draw a point of latest (x, y) coordinates
Step11: Go to step 7
Step12: End of Algorithm
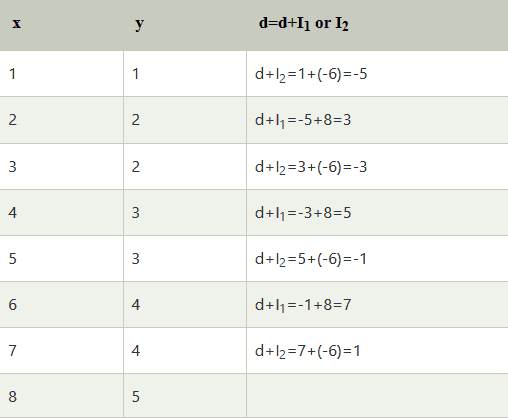
Example: Starting and Ending position of the line are (1, 1) and (8, 5). Find intermediate points.
Solution: x1=1
y1=1
x2=8
y2=5
dx= x2-x1=8-1=7
dy=y2-y1=5-1=4
I1=2* ∆y=2*4=8
I2=2*(∆y-∆x)=2*(4-7)=-6
d = I1-∆x=8-7=1
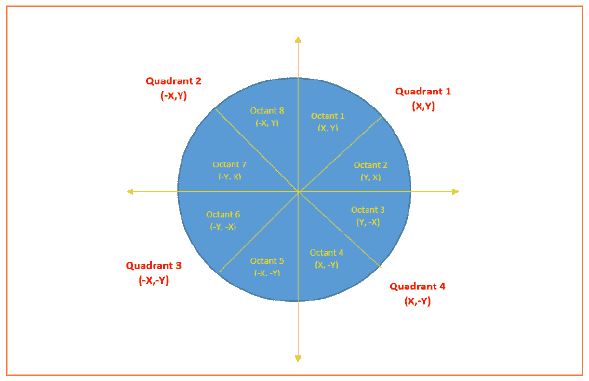
scan converting a Circle:
Circle is an eight-way symmetric figure.
The shape of circle is the same in all quadrants.
In each quadrant, there are two octants. If the calculation of the point of one octant is done, then the other seven points can be calculated easily by using the concept of eight-way symmetry.
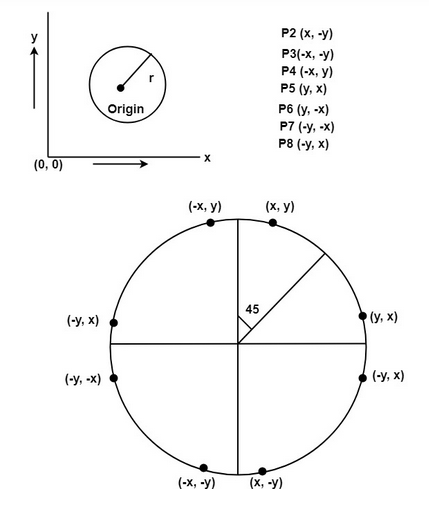
For drawing, circle considers it at the origin. If a point is P1(x, y), then the other seven points will be
So we will calculate only 45°arc. From which the whole circle can be determined easily.
If we want to display circle on screen then the putpixel function is used for eight points as shown below:
putpixel (x, y, color)
putpixel (x, -y, color)
putpixel (-x, y, color)
putpixel (-x, -y, color)
putpixel (y, x, color)
putpixel (y, -x, color)
putpixel (-y, x, color)
putpixel (-y, -x, color)
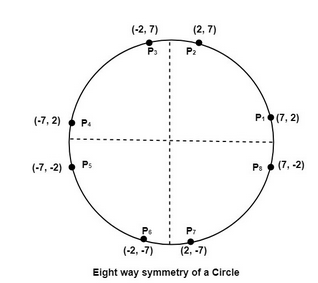
Example: Let we determine a point (2, 7) of the circle then other points will be (2, -7), (-2, -7), (-2, 7), (7, 2), (-7, 2), (-7, -2), (7, -2)
These seven points are calculated by using the property of reflection. The reflection is accomplished in the following way:
The reflection is accomplished by reversing x, y co-ordinates.
There are two standards methods of mathematically defining a circle centered at the origin.
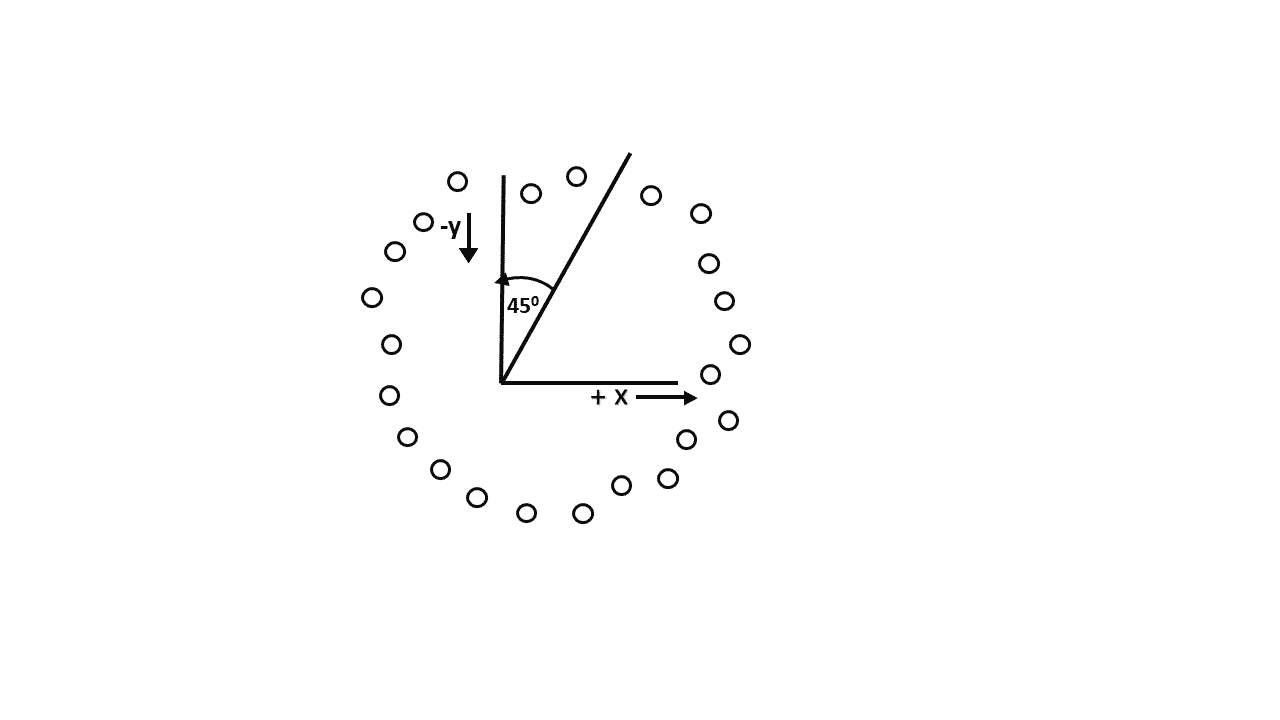
Bresenham's Circle Algorithm:
Scan-Converting a circle using Bresenham's algorithm works as follows: Points are generated from 90° to 45°,
moves will be made only in the +x & -y directions as shown in fig:
Bresenham's Circle Algorithm:
Scan-Converting a circle using Bresenham's algorithm works as follows: Points are generated from 90° to 45°,
moves will be made only in the +x & -y directions as shown in fig:
Step-01:
Assign the starting point coordinates (X0, Y0) as-
- X0 = 0
- Y0 = R
Step-02:
Calculate the value of initial decision parameter P0 as-
P0 = 1 – R
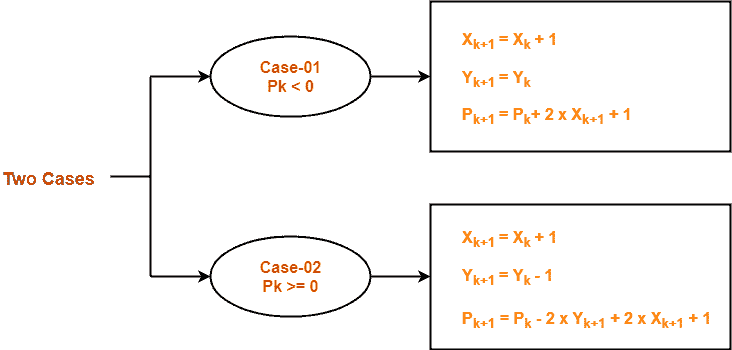
Step-03:
Suppose the current point is (Xk, Yk) and the next point is (Xk+1, Yk+1).
Find the next point of the first octant depending on the value of decision parameter Pk.
Follow the below two cases-
Step-04:
If the given centre point (X0, Y0) is not (0, 0), then do the following and plot the point-
- Xplot = Xc + X0
- Yplot = Yc + Y0
Here, (Xc, Yc) denotes the current value of X and Y coordinates.
Step-05:
Keep repeating Step-03 and Step-04 until Xplot >= Yplot.
Step-06:
Step-05 generates all the points for one octant.
To find the points for other seven octants, follow the eight symmetry property of circle.
This is depicted by the following figure-
Questions on midpoint algorithm
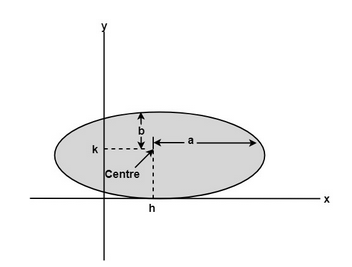
Scan Converting a Ellipse:
The ellipse is also a symmetric figure like a circle but is four-way symmetry rather than eight-way.
bcanotes bca notes bcaquestionpaper
bcanotes bca notes bcaquestionpaper bca questionpaper bcanotes bca notes bcaquestionpaper bca questionpaper bcanotes bca bcanotes bcaquestionpaper bca questionpaper bcanotes bca notes bcaquestionpaper bca questionpaper
bcanotes bca notes bcaquestionpaper bca questionpaperbcanotes bca notes bcaquestionpaper bca questionpaper bcanotes bca notes bcaquestionpaper bca questionpaperbcanotes bca notes bcaquestionpaper bca questionpaper bcanotes bca notes bcaquestionpaper bca questionpaper bcanotes bca notes bcaquestionpaper bca questionpaper bcanotes bca notes bcaquestionpaper bca questionpaper bcanotes bca notes bcaquestionpaper bca questionpaper ccsu ccsunotes ccsu bca cccsu notes ccsubcaquestionpaper bca questionpaperbcanotes
Visit W3Schools.com!Visit W3Schools.com!Visit W3Schools.com!Visit W3Schools.com!Visit W3Schools.com!Visit W3Schools.com!Visit W3Schools.com!Visit W3Schools.com!Visit W3Schools.com!ccsubcanotes ccsu bca cccsu notes ccsubcaquestionpaper bca questionpaperbcanotes ccsubcanotes ccsu bca cccsu notes ccsubcaquestionpaper bca questionpaperbcanotes bcanotes bca notes bcaquestionpaper bca questionpaper
bcanotes bca notes bcaquestionpaper bca questionpaper bcanotes bca notes bcaquestionpaper bca questionpaper bcanotes bca notes bcaquestionpaper bca questionpaper
ccsubcanotes ccsu bca cccsu notes ccsubcaquestionpaper bca questionpaper ccsubcanotes ccsu bca cccsu notes ccsubcaquestionpaper bca questionpaper ccsubcanotes ccsu bca cccsu notes ccsubcaquestionpaper bca questionpaper ccsubcanotes ccsu bca cccsu notes ccsubcaquestionpaper bca questionpaper ccsubcanotes ccsu bca cccsu notes ccsubcaquestionpaper bca questionpaper ccsubcanotes ccsu bca cccsu notes ccsubcaquestionpaper bca questionpaperbcanotes
ccsubcanotes ccsu bca cccsu notes ccsubcaquestionpaper bca questionpaper ccsubcanotes ccsu bca cccsu notes ccsubcaquestionpaper bca questionpaper ccsubcanotes ccsu bca cccsu notes ccsubcaquestionpaper bca questionpaper ccsubcanotes ccsu bca cccsu notes ccsubcaquestionpaper bca questionpaper ccsubcanotes ccsu bca cccsu notes ccsubcaquestionpaper bca questionpaper ccsubcanotes ccsu bca cccsu notes ccsubcaquestionpaper bca questionpaperbcanotes
bcanotes bca notes bcaquestionpaper bca questionpaper bcanotes bca notes bcaquestionpaper bca questionpaper
bcanotes bca notes bcaquestionpaper bca questionpaperbcanotes bca notes bcaquestionpaper bca questionpaper bcanotes bca notes bcaquestionpaper bca questionpaperbcanotes bca notes bcaquestionpaper bca questionpaper bcanotes bca notes bcaquestionpaper bca questionpaper bcanotes bca notes bcaquestionpaper bca questionpaper bcanotes bca notes bcaquestionpaper bca questionpaper bcanotes bca notes bcaquestionpaper bca questionpaper ccsubcanotes ccsu bca cccsu notes ccsubcaquestionpaper bca questionpaperbcanotes
ccsubcanotes ccsu bca cccsu notes ccsubcaquestionpaper bca questionpaperbcanotes ccsubcanotes ccsu bca cccsu notes ccsubcaquestionpaper bca questionpaperbcanotes bcanotes bca notes bcaquestionpaper bca questionpaper
bcanotes bca notes bcaquestionpaper bca questionpaper bcanotes bca notes bcaquestionpaper bca questionpaper bcanotes bca notes bcaquestionpaper bca questionpaper
ccsubcanotes ccsu bca cccsu notes ccsubcaquestionpaper bca questionpaper ccsubcanotes ccsu bca cccsu notes ccsubcaquestionpaper bca questionpaper ccsubcanotes ccsu bca cccsu notes ccsubcaquestionpaper bca questionpaper ccsubcanotes ccsu bca cccsu notes ccsubcaquestionpaper bca questionpaper ccsubcanotes ccsu bca cccsu notes ccsubcaquestionpaper bca questionpaper ccsubcanotes ccsu bca cccsu notes ccsubcaquestionpaper bca questionpaperbcanotes
ccsubcanotes ccsu bca cccsu notes ccsubcaquestionpaper bca questionpaper ccsubcanotes ccsu bca cccsu notes ccsubcaquestionpaper bca questionpaper ccsubcanotes ccsu bca cccsu notes ccsubcaquestionpaper bca questionpaper ccsubcanotes ccsu bca cccsu notes ccsubcaquestionpaper bca questionpaper ccsubcanotes ccsu bca cccsu notes ccsubcaquestionpaper bca questionpaper ccsubcanotes ccsu bca cccsu notes ccsubcaquestionpaper bca questionpaperbcanotes